Research

We studied financial astrology before we built anything.

Financial astrology is not one method. It is a set of competing schools, each with its own inputs, time horizon and way of delivering results. We reviewed the most established of them, tested their core inputs against gold market data, and built our engine from the parts that held up.

See how the readings have done since launch: the track record →

Seven approaches, reviewed

For each school: how it works, how it reaches readers, what we took from it, and why it cannot stand alone.

I

Cycle-and-confirmation analysis

Finds each market's rhythmic cycle (for example, a primary cycle of around 18 weeks), then looks for planetary aspects and stations near expected turns, confirmed by chart patterns and momentum.

Typical delivery
Daily, weekly or monthly analyst reports; annual forecast books
What we took
Cycle-plus-planet confluence, and the rule that planetary signals need technical confirmation
Why not alone
Analyst-interpreted; a report, not a continuous score
II

Instrument “birth chart” methods

Treats the moment a market first traded as its natal chart and reads current transits against it.

Typical delivery
Annual prediction books; daily or weekly letters
What we took
Our Natal Transit Score uses the COMEX gold futures chart of 31 Dec 1974
Why not alone
Long-horizon narrative forecasts that are hard to reproduce independently
III

Date-flagging newsletters

Lunar phases, first-trade charts and long planetary cycles used to flag high-significance trading dates.

Typical delivery
Monthly newsletter of key dates
What we took
Date-level event timing, shown in our Event Strip as one of the inputs
Why not alone
Monthly cadence; flags dates, gives no continuous bias
IV

Macro-plus-astro research desks

Macroeconomic analysis read alongside planetary cycle charts and aspect calendars.

Typical delivery
Premium daily letters with price levels; live signals; institutional desks
What we took
Macro and astro read side by side, not in isolation
Why not alone
Price: daily letters can exceed $2,000 per quarter; signal-based delivery
V

Aspect-sum indices

Adds weighted values of planetary aspects into one time series; turns are read as possible turning dates. The best-known is a public formula from the 1940s.

Typical delivery
Public formula, widely charted
What we took
Scoring aspects numerically into a single line
Why not alone
Often marks timing of turns, not their direction
VI

Vedic sidereal transits

Planet positions in the sidereal zodiac, using a fixed sidereal offset (ayanamsa).

Typical delivery
Traditional Indian practice
What we took
Our ephemeris: every position is computed by our AstroPlanetary engine
Why not alone
A coordinate system, not a signal on its own
VII

Declination and parallels

Planets' north–south position; parallels and out-of-bounds periods invisible on a standard 360° wheel.

Typical delivery
Specialist studies
What we took
Evaluated
Why not alone
Result to be published with the test log
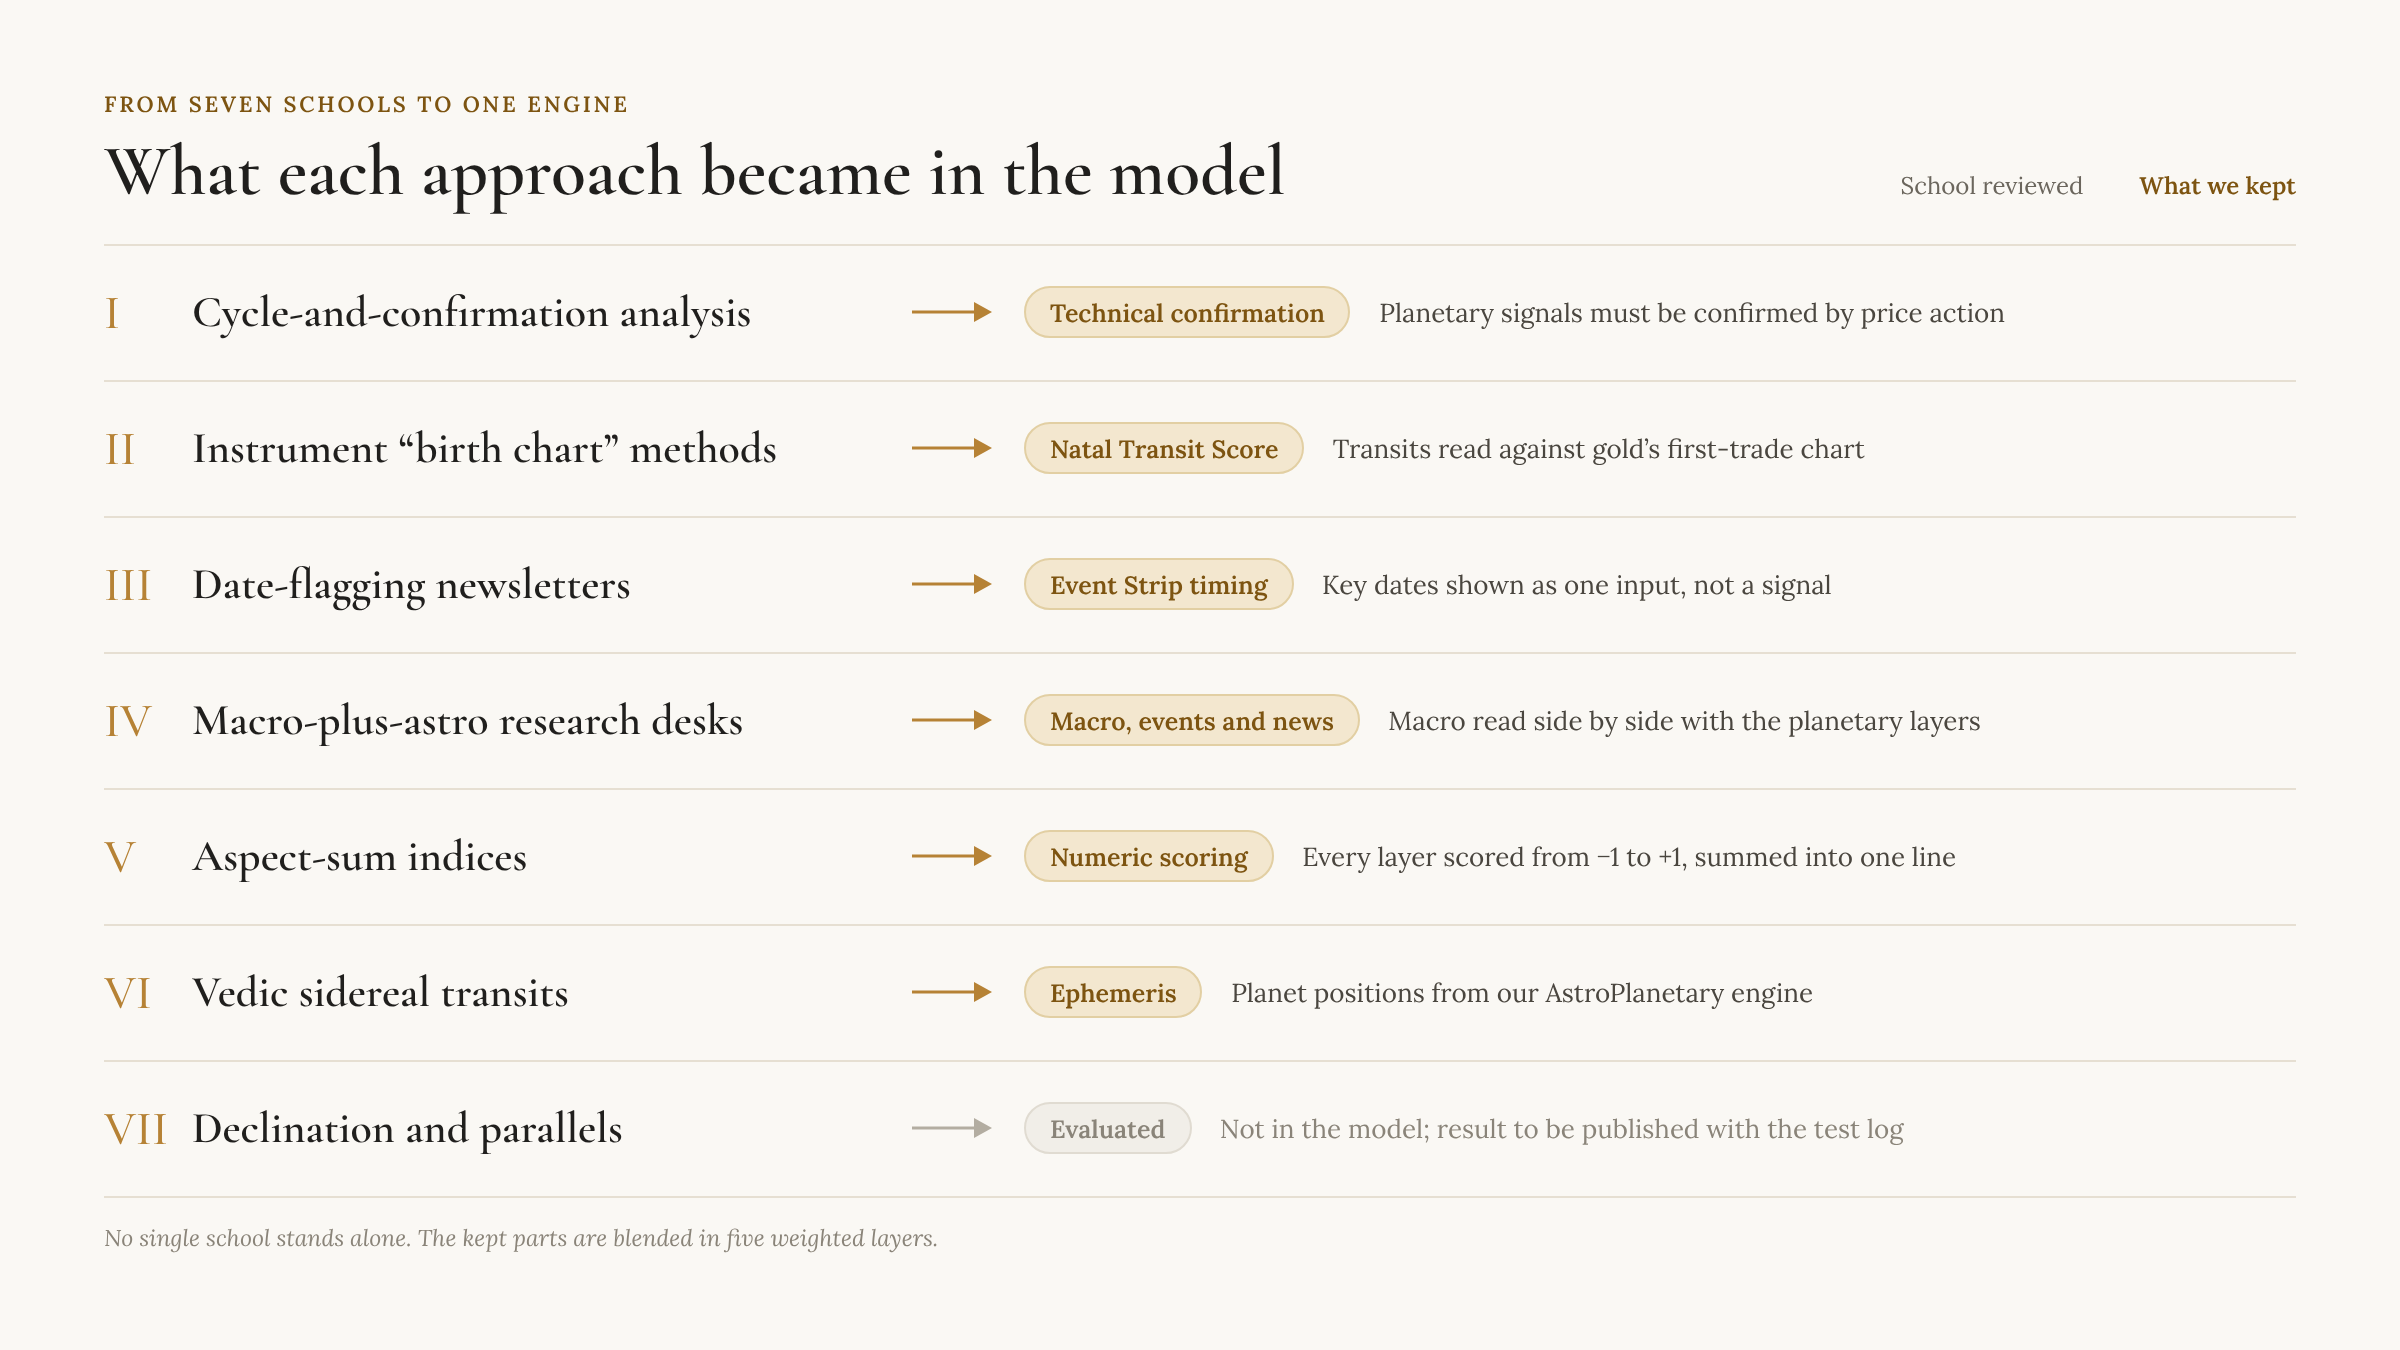
Table mapping each of the seven schools reviewed to what was kept in the model: technical confirmation, Natal Transit Score, Event Strip timing, macro events and news, numeric scoring, AstroPlanetary ephemeris, and declination evaluated but not used.
From seven schools to one engine: what each approach became in the model. Tap or click the image to enlarge.

How we tested

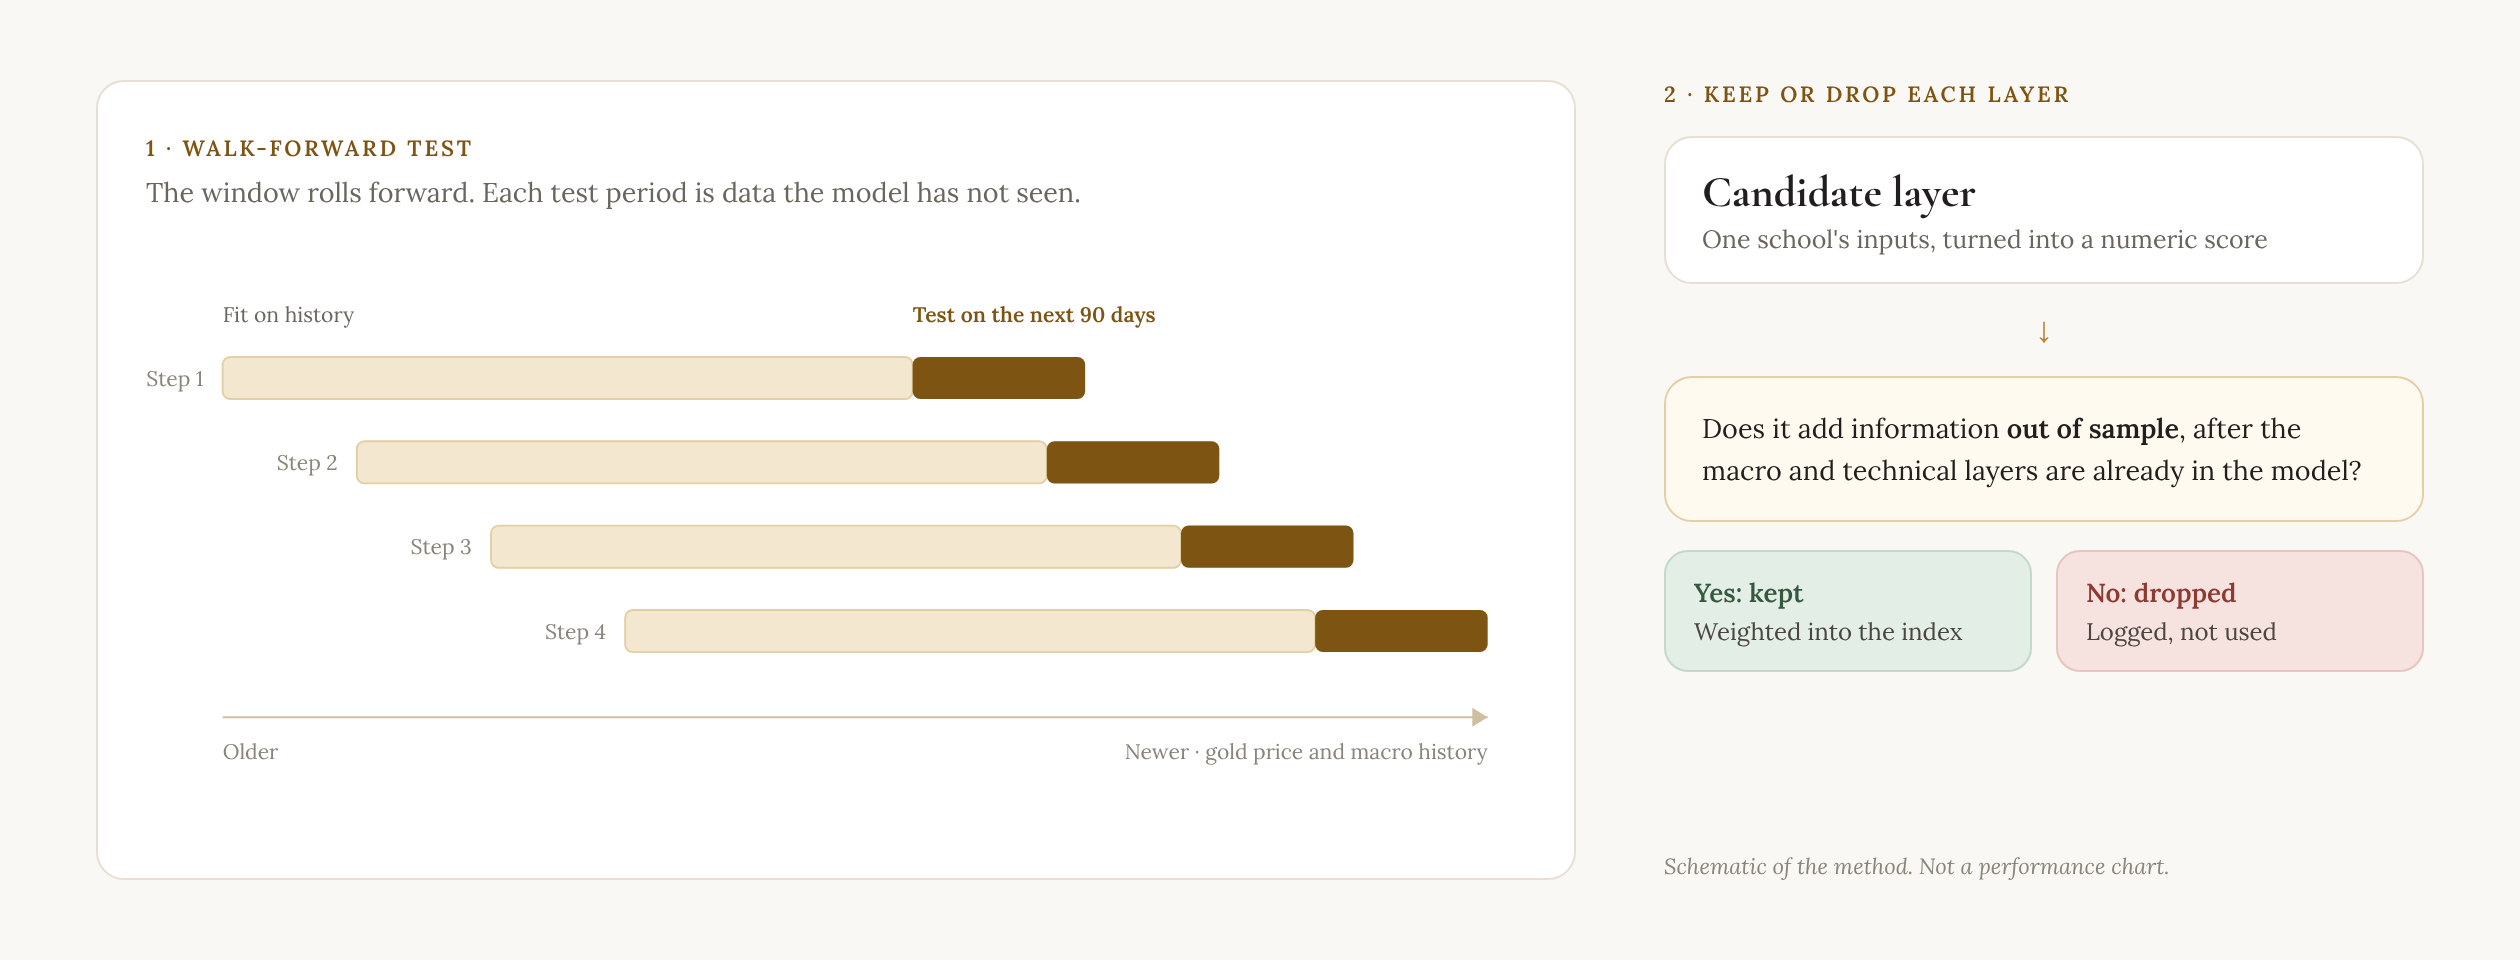
Each approach's inputs were turned into a numeric score and run against a 90-day walk-forward window of gold price and macro history. A layer stayed only if it added information out of sample, after the macro and technical layers were already in the model.

Walk-forward test schematic: a fitting window on past gold and macro history followed by a 90-day test window, rolled forward in four steps; each candidate layer is kept only if it adds information out of sample after the macro and technical layers.
How each layer was tested: a rolling 90-day walk-forward window, and a keep-or-drop rule for every candidate layer. Tap or click the image to enlarge.
No single school explained gold on its own. The combination did better than any one part.

That is why the index blends five layers instead of following one method, and combines them with a weighted score.

See the methodology