Five layers, one reading, recalculated every hour.
Every reading of the Astro-Macro Momentum Index comes from the same deterministic process. Given the same planetary positions and market data, the engine returns the same number. This is financial astrology treated as a testable input, not as a belief.
The five layers
How the layers combine
Each layer is scored from −1 (headwind) to +1 (tailwind). The scores are weighted and summed into a composite score, S, then mapped onto a 0–100 scale.
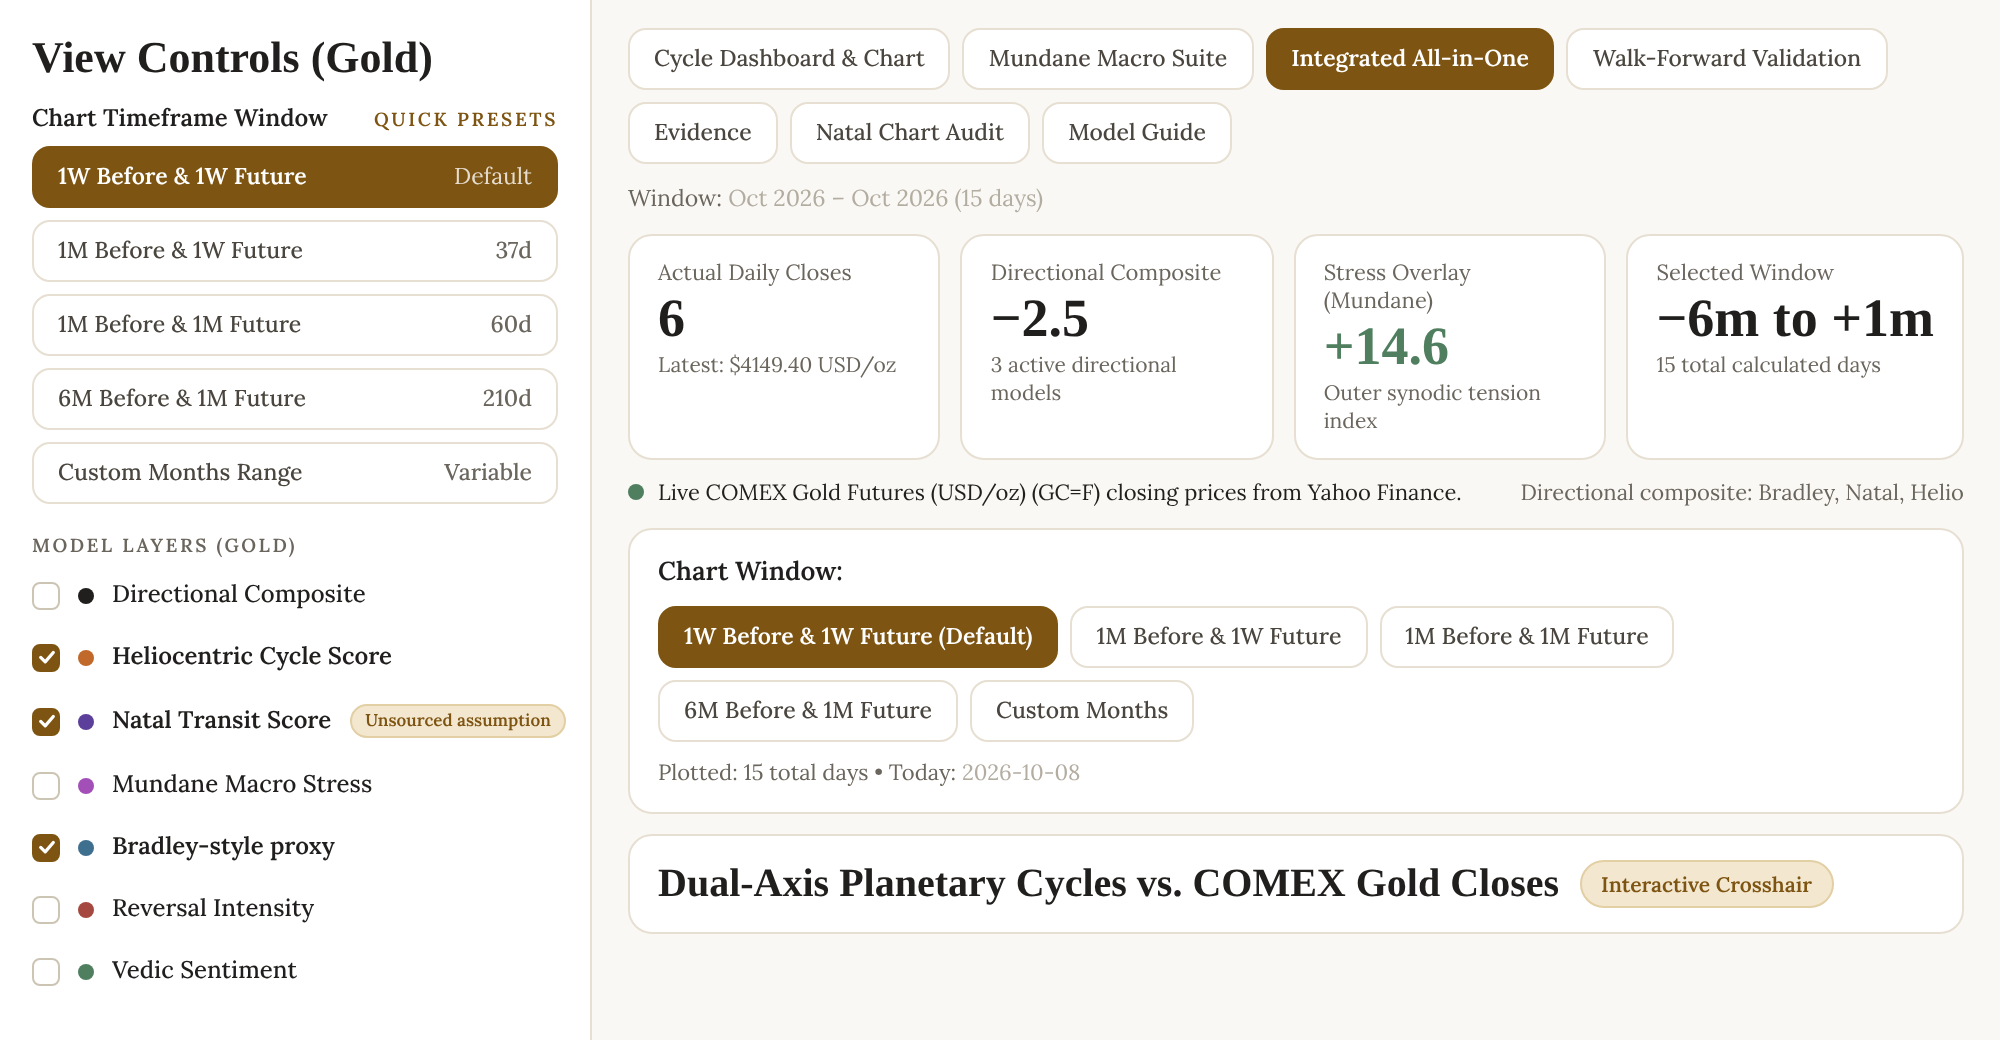
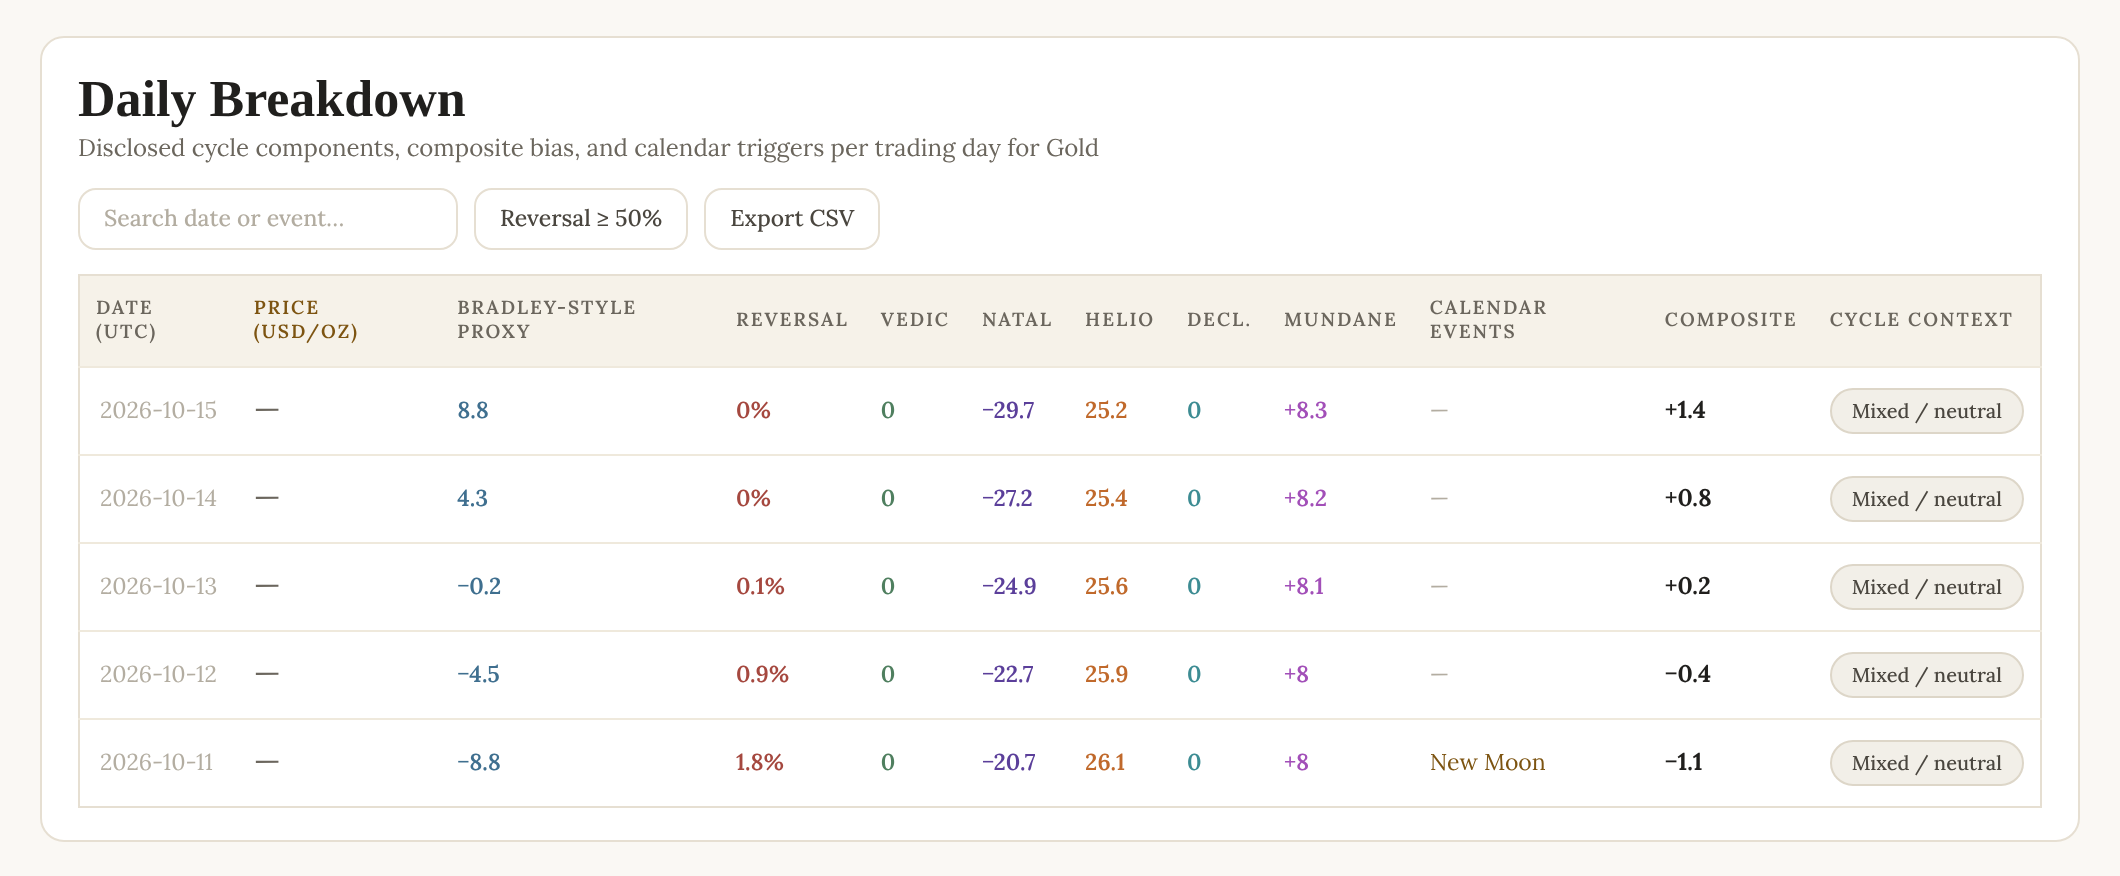
These views are the behind-the-scenes workings. They are shown so the method can be checked. What members see is the final output: a simple, actionable view of the trend.
How the weights were set
We tested each layer, alone and in combination, against a 90-day walk-forward window of gold price and macro history, then fixed the weights that performed most consistently out of sample. Weights are re-tested on a rolling walk-forward basis. Every change ships as a new model version, shown on the dashboard.
Where AI fits
AI reads financial wires and geopolitical headlines and scores their likely effect on gold sentiment. It feeds one input and cannot override the model. If a major crisis is flagged, all four session readings switch to Neutral until conditions settle. AI was also used to analyse past data across all candidate models and to pick the winning combination and weights.
Model changelog
Every model version, dated: what changed, why, and the test result that justified it.
| Version | Date | Change |
|---|---|---|
| v1.15.0 | At launch | Launch model. Five layers as described on this page, weights fixed on the walk-forward test. |
Limits
The index reads the backdrop, not the next tick. It can stay mixed for weeks. Sudden events can override every layer, which is why crisis mode exists. Planetary cycles are a non-causal framework; we use them because we test them, not because we claim they move price.
What this is not
Not a price forecast, not a trade signal, not a claim that planets cause price moves. We do not claim perfect prediction. We keep testing and updating the models and weights as fresh data arrives and planetary conditions change. Our view is that the present calls for a data-driven approach that pairs a traditional framework with AI.
See the reading this method produces.
See the platformOr start with one reading a week, free.